

Making your internal assessment (IA) in Math AI can be tricky, especially if you think that math is not your strong suit. Don’t worry, we’re here to help! Here is a comprehensive guide to the Mathematics: Applications and Interpretations IA.
What is the Math AI IA?
The Math AI IA is a report of how you can apply your learnings from the Math AI course into exploring a topic of your choice. Cooking, sports, architecture, finance — this topic can be anything that interests you, and it is a chance to explore the math behind it in a guided way.
The Math AI IA is worth 20% of your total course grade in Math AI. As with all IAs, the International Baccalaureate Organization (IBO) sets a standard criteria* for marking IAs, outlined here below:
| Criterion | Simply Stated | Marks Possible |
| (A) Presentation | Is your report logical and organized? | 0-4 |
| (B) Mathematical communication | Do you define key terms? Do you use appropriate notation? | 0-4 |
| (C) Personal engagement | How do you show the thought process behind your methods? | 0-3 |
| (D) Reflection | How do you evaluate the strengths and weaknesses of your methods? | 0-3 |
| (E) Use of mathematics | Do you understand the math behind your methods? Are the concepts you apply at the level of the Math AI course (SL/HL)? | 0-6 |
*For a more comprehensive look at the criteria, kindly refer to the Mathematics: applications and interpretations guide (2019) from the IBO.
For HL students, Criterion E explicitly states that students must either use concepts only found in the HL syllabus or use concepts from the SL syllabus in a “complex way that is beyond what could reasonably be expected of an SL student” (IBO, 2019). A good way to check for this is through looking at your Math AI formula booklet. If you are an HL student, your IA should include at least one formula marked as Additional Higher Level (AHL). Examples of these formulas include the logistic function, transformation matrices, and the Poisson distribution.
SL students may choose to use either SL or AHL formulas, but HL students are strongly recommended to apply as many AHL concepts as possible in their IA. Other than this, there are no differences between how IAs are graded across SL and HL.
Choosing your topic
Because math has various real-world applications, this is an incredibly flexible IA to pick a topic for. To figure out where to start, there are generally two ways to find a topic: (1) Find a topic you are interested in, then apply it to at least one Math AI lesson; or (2) find a Math AI lesson you enjoy, then identify one practical application of that topic.
Many of my classmates found their IA topics the first way, starting off with something they were passionate about and then looking through the syllabus for concepts they could apply. For example, one of them liked baking, so they decided to explore the relationship between the ingredients in the recipe and how their cupcakes turned out.
In my experience, I chose my topic the second way. I had no idea what to do for my IA topic, but I did enjoy making Voronoi diagrams when we covered them in class. I found the concepts easy to understand, and I liked working with something I can visually see. From there, I connected Voronoi diagrams with things that interested me such as healthcare.
Regardless of how you choose your topic though, a sturdy Math IA topic should enable you to:
- Be genuinely interested about it
- Apply at least one lesson from the Math AI SL/HL course
- Have at least one set of data you can do calculations with
- Produce results you can evaluate (e.g. Are my calculated answers realistic or not?
Structuring your IA
Now that you have your topic, it is time to structure your IA. Although there are no strict rules for how to assemble your IA, Math IAs generally follow this flow:
- Rationale
- Plan of action
- Methodology
- Evaluation and Extensions
- Conclusion
It may look like a lot, but don’t worry! It is simpler than you think, and these steps will be further explained in order below. I will use my own IA in Math AI SL as an example, but feel free to cross-reference this with any sample IAs provided by your teacher.
Rationale
The Rationale is essentially the introduction of your IA. It outlines what you want to explore (i.e. your research question), the reason why you are interested in it, and the background behind it.
As a whole, your Rationale should only be about one page long. In 2-3 paragraphs, you should be able to answer the following questions:
| Question | Short Example | Important Notes |
| What exactly are you researching? | This investigation aims to determine the best place to build a new hospital in Mandaue City and see if this improves hospital load balance. | State this clearly. No need to introduce math at this point. |
| What is your personal experience/connection with this? | As an emergency team volunteer at our local health center, I observed that hospitals located farther from other hospitals had more patients. | Do not be afraid to use personal pronouns when talking about your own experience. |
| Why is this important? | New hospitals are being built in Mandaue City at a rapid rate. However hospitals cannot serve residents effectively if they are not spread out around the city. If a new hospital is placed too close to an existing hospital, the two hospitals would end up serving the same area. This would not improve hospital accessibility in the city, as hospitals farther from clustered hospitals would still have to serve a larger area with more patients (Burkey, 2010; Gao et al., 2021). | Remember to have in-text citations for any supporting research. |
Although this is an academic paper, using personal pronouns like ‘I’ and ‘we’ is not discouraged in the Rationale as these are used to convey personal engagement (Criterion C). That being said, you must ensure that you balance your personal experiences with research to support your research question.
Plan of Action
The Plan of Action is all about how you accomplish your research aim, including the mathematical concepts you will use to do so. In 1-2 pages, this is what you must do with a Plan of Action:
| What to Do | Short Example | Important Notes |
| State the Math AI concepts you will use. | This investigation will involve the creation and interpretation of Voronoi diagrams. | The concepts must match the course level you are in (SL/HL). |
| Define key terms. | A Voronoi diagram is a visual representation of a plane that is divided into individual regions closest to a given set of points. | It may be helpful to include a diagram. |
| Summarize what you plan to do. | The methodology is divided into four parts: creating the initial Voronoi diagram, determining the best location (Site X) for the hospital, adding Site X to the Voronoi diagram, and testing for improvements in hospital service area using the t-test. | |
| State how you will get and process your data. | The Voronoi diagram will be made on GeoGebra with a Google Maps image of Mandaue City marked with its existing hospitals. The list of existing hospitals will be taken from the Department of Health (Department of Health, 2022). | Remember to have in-text citations for any supporting research. |
Given the flexibility of the Math AI IA, some students may struggle with figuring out the steps for their methodology. Topic choice is key to figuring out the structure of your IA. While all IAs in Math AI will have elements in common, certain topics may involve sections that may not be necessary in others.
Some topics may involve collecting primary data through a survey or an experiment. For example, my friend who did baking for her IA had to vary the amount of an ingredient she used and then measure the resulting height of her cupcakes. As such, IAs like these may require sections for procedures and results.
Other topics may use secondary data from databases. For example, some IAs I have seen look at mental health statistics and compare them with statistics for economic growth (e.g. GDP). Since these IAs typically work with large databases, they must set a range for the data they will use (e.g. Real Madrid scores from 2010-2020). These IAs also usually have sections for making and explaining graphs.
Still, other topics may instead assign their own data points through modeling. What this usually means is that they place images on modeling software (e.g. Desmos, GeoGebra) and then mark points of interest on the graph. This is common for IAs using Voronoi diagrams and calculus. For example, this was my set-up in GeoGebra:
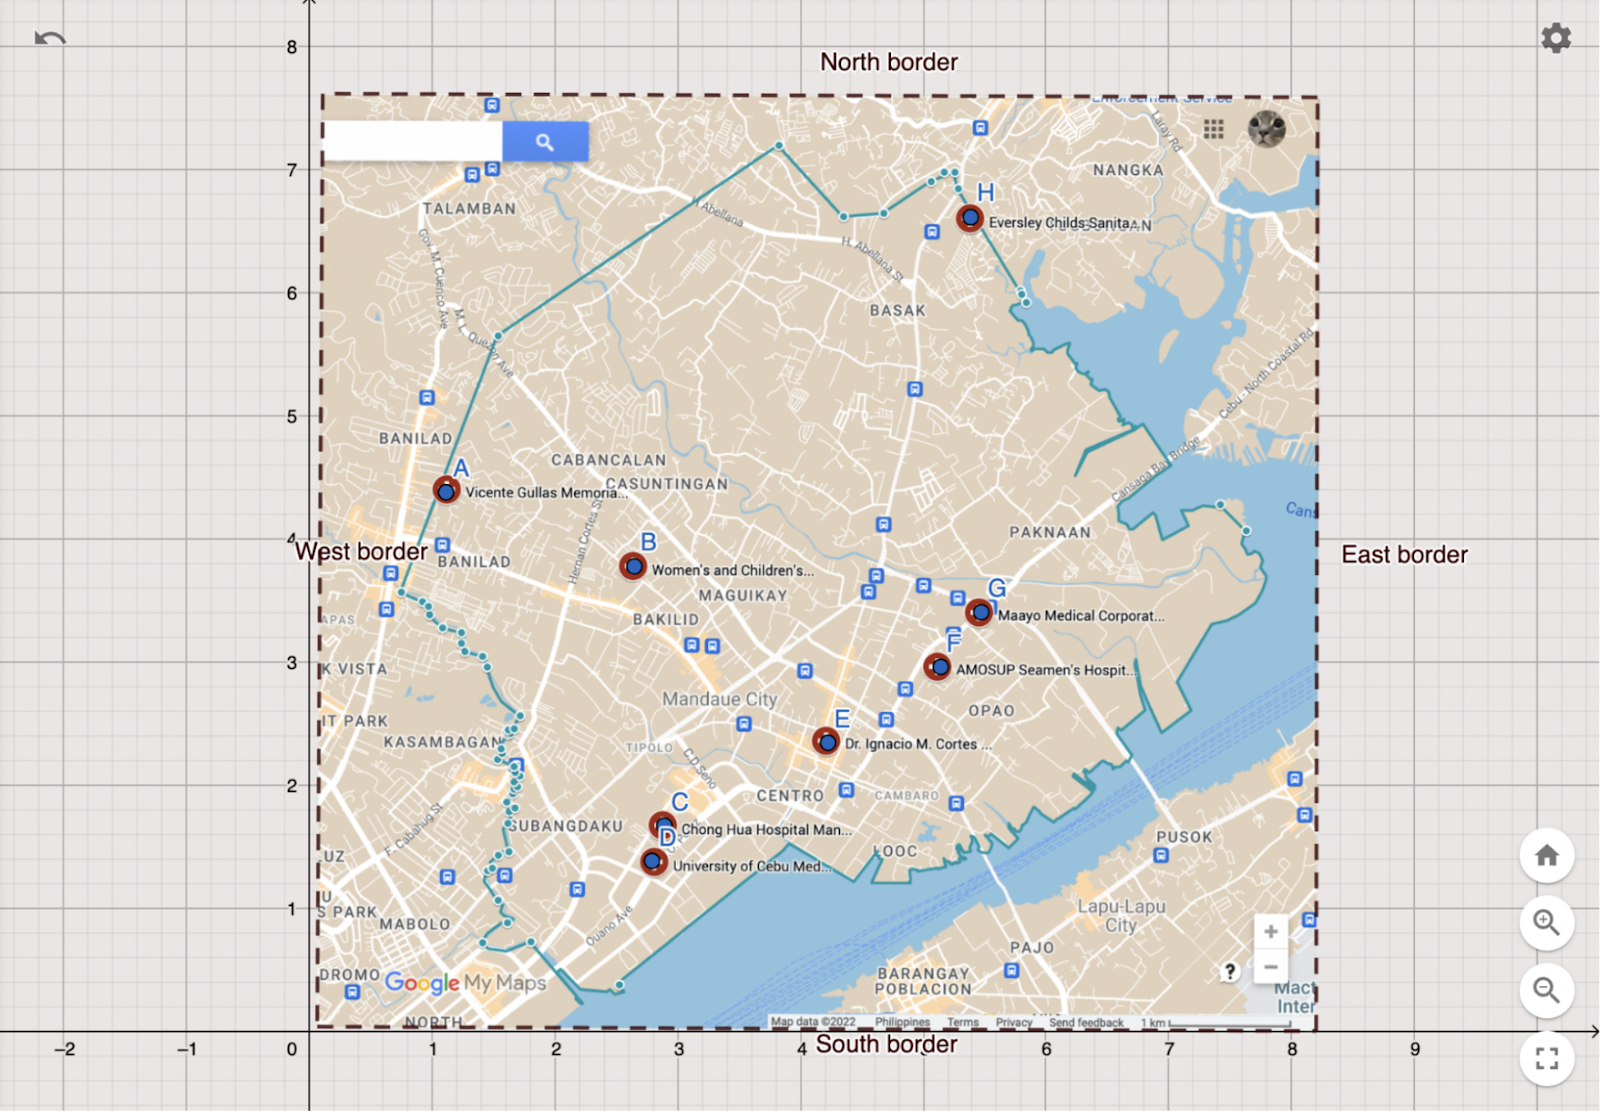
A sample set-up for modeling IAs. In this case, I placed an image of the city map onto GeoGebra and adjusted it so that a unit of 1 on the graph represented 1 kilometer. I then marked the locations of hospitals in the photo. For example, Hospital A had the coordinates (1.11, 4.38) on the graph.
The beauty of the Math IA is that you can drive it in any direction you want. In reality most IAs use a combination of methods and data sources, adding sections for each part as needed. Whatever methods you use though, be sure that they follow a logical order (Criterion A) and show your thought process in terms of math (Criteria C and D).
Methodology
Typically the longest section of the IA, the Methodology is where you carry out the methods to achieve your research aim. How this looks would vary with your Plan of Action, but this is where mathematical communication (Criterion B) and use of mathematics (Criterion E) are highly emphasized.
This is a general guide you can follow for your methodology:
- Introduce the step
- State why you are doing the step
- Present the formula
- Do a sample calculation with the formula for one data point
- Present the calculated results with a diagram or a table
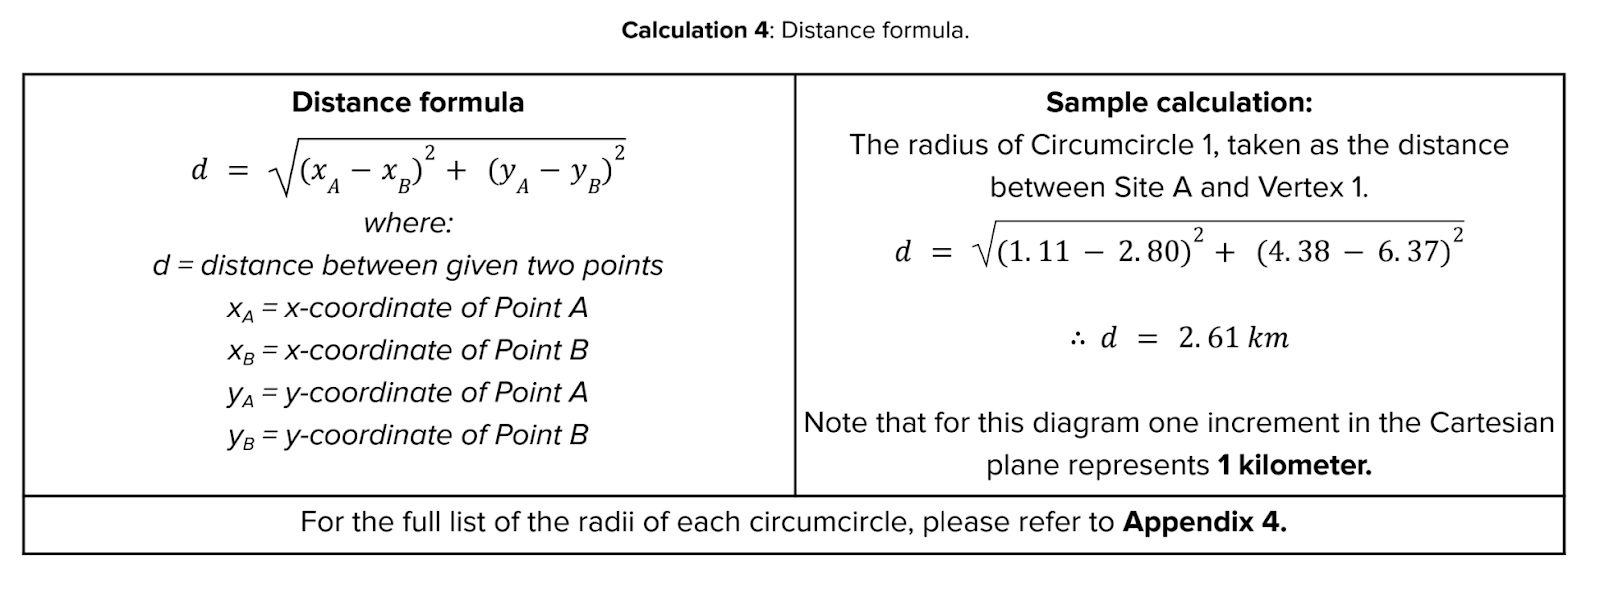
This is an example of a sample calculation I did in my IA:
Here are some methodology tips that may be useful:
- Label your diagrams and calculations so that you can refer to them throughout the methodology.
- IAs can be handwritten or typed. If you are typing your IA, use the Equation function to ensure that you express proper mathematical notation.
- Properly denote subscripts and superscripts, as computer notation (e.g. “e^2.1456” instead of “e2.1456“) is penalized under Criterion B.
- Note: Computer notation is acceptable if it is software generated. For example, if you are including a table from a database where the exponents in numbers are marked with ^, it is acceptable to have the numbers as they are as long as you properly cite the database.
- For larger sets of data, check with your teacher if it is acceptable to place the full list of calculated results in an appendix. If you do choose to include an appendix, don’t forget to reference it when presenting your data.
- Keep a checklist of the steps you have done so that you do not accidentally repeat calculations.
- If you have to use a formula again, simply cite it (e.g. “Refer to Calculation 8”) instead of doing another sample calculation with it. Repeated calculations are penalized under Criterion A.
- Explain the implications of your decisions whenever possible. For example, will running this statistical test account for one variable but not another? This will help the examiner understand the decisions behind your process (Criterion D).
Methodology usually takes up more than 10 pages in an IA, owing to the diagrams and calculations in it. Regardless of the length, what is essential is that the reader can follow your train of thought. You have learned a lot of math over the course, so take the time to show it!
Evaluation and Extensions
The Evaluation and Extensions section is where you describe the strengths and weaknesses of your methodology. It is also where you outline future opportunities for research based on your work. Sometimes it is placed right after the Conclusion, but it might be helpful to have this section before the Conclusion instead so that you can refer to it as you summarize your work.
This section is pretty straightforward, but many students miss marks because they simply evaluate and forget to include extensions. Pro tip: Use the weaknesses in your evaluation as chances for future research! You can do this in three steps:
| Step | Shortened Example |
| Challenge an assumption you were making throughout your methodology | The investigation assumed that a hospital’s patient load was directly proportional to the size of the area it serves. |
| Provide an example countering your assumption | It is possible that a hospital may serve a large area but not have a heavy patient load because that area is only sparsely populated. |
| Use that weakness as an opportunity for future research | One extension can be to investigate the relationship between population density and hospital patient load using Pearson’s correlation coefficient. |
The Evaluation and Extensions section is key to scoring marks in Criterion D, which is about reflecting on the quality of your work. It is typically only 1-2 pages long.
Conclusion
Now that you have done the math, it is time to share your results. Your Conclusion should:
| What to Do | Shortened Example | Important Notes |
| Recap the aim of your research | This investigation aimed to determine the ideal location for a new hospital in Mandaue City and statistically determine whether adding this hospital would reduce the mean area served by each hospital. | You can rephrase this from your Rationale. |
| Summarize major steps in your methodology | Modeling through Voronoi diagrams determined this ideal location (Site X) as the point with the Cartesian coordinates (2.79, 6.38), opportunely located on a vacant lot in Canduman, Mandaue City. The addition of this new hospital was predicted to reduce the individual areas served by each hospital, as represented by Voronoi cells. To check for this, the mean cell areas before and after the addition of Site X were calculated and run with a t-test. | You can introduce them with all the steps first, then all the results. Another option would be to alternate between major steps and results. |
| Summarize the major results and what they mean | It was found that the mean cell area in the new Voronoi diagram was less than in the initial Voronoi diagram. This suggested that hospital accessibility improved with the addition of Site X, as the average area served by each hospital in Mandaue City became smaller. However, this improvement was demonstrated to be statistically insignificant through a one-tailed t-test. The calculated t-value (t = 0.53) was found to be less than the critical value at the 5% level of significance (tcrit = 1.753). | |
| Share your overall result | Therefore, although the average area served by each hospital was reduced with Site X, this reduction was not enough to produce a significant change in hospital load balance in Mandaue City. | Check to see if your results answer your original aim. |
Formatting your IA
Before you submit your Math AI IA though, there are a few formatting checkpoints it must pass:
- Does it have a cover page? The cover page must contain the IA title, subject (Mathematics: applications and interpretations SL/HL), page count, and candidate code.
- Does it have a table of contents and page numbers? The table of contents must follow the citation format required by your school (e.g. APA, MLA, Chicago). Page numbers usually do not include the cover page.
- Are the paragraphs double spaced? The IB requires double spacing in Math AI IAs to allow examiners to annotate IAs while marking.
- Are the tables and diagrams labeled? All tables and diagrams must be labeled with a figure legend, including those at the appendix.
- Do you have a bibliography or reference page? This is typically placed at the very end of the IA, after the Evaluations and Extensions section and before the appendix (if any).
Does your IA tick all the marks? If yes, then congratulations! You have finally finished your IA in Math AI.
Reflection
Personally I learned a lot while doing my IA in Math AI SL. It was tough figuring out what to research about and how to do it, but once I had my methodology set the momentum continued. Before I knew it, I had completed my IA in math — a subject I once thought I was hopeless in! I hope you will find your Math AI IA journey incredibly rewarding, building your confidence in math one step at a time.
You may also like…
- An Approachable Guide for Analytical Students: IB Mathematics AA by Mateusz Konat and Wiktoria Wojnarowicz
- Other blogs about IB Math
thank you SO MUCH, I was completely lost at this freaking IA, but with this article I was able to start writing